
About fraud in general, we know it exists, we know our rulers admit it exists, or used to. We need to be careful about claims of fraud now, putting forth only our best evidence (example, example). Time is short and we don’t need distractions.
It needs to be us, not the enemy, discovering our flaws.
See code update at end: 952 PM, Thursday night.
THE CLAIM
Many have asked me about Shiva Ayyadurai Inventor of Email’s fraud analysis, that you can watch on YouTube, or here (he always puts as part of his name Inventor of Email).
Here’s the gist of the method in this picture (or, see updates, one method, all of which are similar):

People in Michigan, the greatest state, could vote straight R or D ballots for all offices, or individual ballots, selecting a mix of candidates for offices.
One plot: the x-axis is the total number who voted a straight Republican ballot, divided by all votes, straight or individual, inside a precinct. In other words, the percent of all votes that are straight R ballots. Update: it appears IOE does total number straight Republican divided by total of all straight ballots.
One y-axis is the number who voted for R for president (Trump) out of those voting individual ballots minus the x-axis value. Update: Another is percent R among all individual ballots minus the Republican straight percentage. Yet a third possibility, suggested in the comments, is that y-axis is R votes divided by all votes of any kind minus x.
In any of these techniques that minus is the problem.
Here is a brief explanation of the first interpretation of the technique. For others, which are similar, see the Updates.
A friend of mine gave me this first example. Suppose x = 100%. Then there are no votes left for individual ballots, because everybody in the precinct voted straight R. Then necessarily y = 0%, it’s maximum.
Assume no fraud. When x = 99%, then 1% of the total votes are individual ballots (assuming no straight D ballots). If Trump wins 80% of these individual ballots—a huge amount!—he’s in the hole, because y = 80% – 99% = -19%.
Thus even though Trump got 99% + 0.8* 1% = 99.8% of all votes in the precinct, his “score” is -19%. This kind of thing repeats for all values of x. The decrease in y as x increases is exactly what we’d expect to see under normal voting conditions.
That is really it for my analysis. The rest of this article is fleshing this counter-argument out. It will not be easy going.
Updates
Some are saying IOE meant x = R straight ballots/(R straight ballots+D straight ballots).
And y = (R individual / R individual + D individual) – x.
Grant this. But it doesn’t change anything, really.
If x = 100%, then any number of individual ballots can remain, as commenters are saying. But then Trump would have to win 100% of them for y to equal it’s maximum of 0.
If x = 99% then again it could be any number of individual ballots remains, and if Trump wins 80% of them, still a huge amount, then y = 80-99% = -19%, just as before.
If x = 50%, then again there could be any number of individual ballots, and Trump has to win more than 50%, a heavy task, to keep y > 0.
I don’t see how this saves his method.
Consider x is not a as good measure of R strength in a district as what I thought he originally meant. I mean this interpretation is worse for this theory.
It could be there are 100 votes in the district, say. If only 1 is straight R, then x = 100%. Then 99 are individual. If Trump wins 90, a huge take, then y = 90/99 – 100% ~ -9%. More realistically, if x = 100 in this scenario, Trump may take as many as half of the remaining, then y ~= 50% – 100% = -50%.
Or if x = 90/100, i.e. no straight D, leaving 10 individual, and if Trump takes 80%, then y = -10%.
Later this evening I’ll add comments on the examples.
DETAILS
For clarity,
x = # straight R ballots / # total ballots,
y = # individual R ballots / # individual ballots – x,
# total ballots = # straight R + # straight D + # individual
OR
# total ballots = # straight R + # individual,
where # individual includes # straight D. The x and y are converted to percentages by multiplying by 100.
Inventor of Email never makes it clear which # total ballots he’s using. I’m guessing (as you’ll see) the first.
Suppose x = 0%, i.e. no Rs voted a straight ballot. It could be all the ballots are D straight ballots, or there was a mix of straight D and individual. Surely there were some straight Ds.
Since the max x (for Rs) in all Inventor of Email’s Oakland example was ~70% (this maximum changed by county), we might suppose the same is true for max D straight tickets. Which is to say, there were not any 100% D straight tickets in any precinct, but maybe there were some 70%s in Oakland. That would leave about 30% independent votes.
Any number of individual votes in this 30% (or whatever number it was) for Trump would give a y > 0 when x = 0. We gather from the 5-6% average y when x was near zero (see the figure) that Trump got the few Rs who didn’t vote straight tickets, and perhaps a D or two who also didn’t vote straight ticket. R support is low in these precincts, because x is small. And we know Oakland is a predominately D county.
As x increases, it’s true the precinct becomes more R, and hence more votes go to Trump. But then there’s fewer individual ballots out there, so Trump would have to capture higher and higher percentages of the individual tickets to keep the y positive. The larger x is, probably the smaller the precinct is in voting size, meaning it’s likely a good deal of the remaining individual ballots will go to Ds.
In other words, the higher x is, the more likely y is negative. And the smaller x is, the more likely y is positive. The exact “0 crossing” for y depends, of course, on the D/R ratio in the county. For example, here is Inventor of Email’s Macomb county example:

The max R straight ticket precinct is ~90%, which suggests this county has more base R support, and then we see y doesn’t dip below 0 until around x = 70%, which confirms it.
This county has the same shape, the x-y curve, for the same reason, though.
Let’s go through some concrete examples, using Oakland county as a base.
Example 1
X = 0%, meaning no straight Rs. Suppose 70% are instead straight D, mirroring the top R percentages. Again, I don’t recall hearing Inventor of Email mentioning straight D ballots. But if they existed, which they surely must have, then the remaining individual ballots are fewer than you’d think. Because that’s a smaller number, there’s a higher chance Trump would score a greater percentage of the ballots (smaller samples have more variability).
A 70% straight D leaves 30% of the remaining vote for individual ballots. We know ys for x near 0 were ~0-10% (see the picture). That means about 90-100% of the remaining 30% went to Ds, the other for 0-10% R (Trump). So y = 0-10%. This makes sense.
If instead Inventor of Email classed straight D ballots as “individual”, then 100% of the ballots when x = 0% would be classed “individual”. That means between 0-10% of people out of all voters would have had to vote for Trump to get y = 0-10%. That could happen, too.
In the video, Inventor of Email thinks small x votes are probably fraud free, and that some algorithm switched on when x hit 20%. But I’d think any precinct with y = 0 when x = 0, or when both are very low, means no or almost no votes were recorded for Trump. I’d find that suspicious.
Example 2
X = 20%, meaning 20% straight Rs. How many straight Ds we don’t know, except it must be less than 80%. Suppose straight D goes down in proportion; maybe there’s 50%. That again leaves 30% of the remaining vote for individual ballots. In Oakland, with x = 20%, y was around -10-10%. That means Trump got between 10-30% (of the 30%).
In other words, Trump got a little more of the individuals than when R support was higher, than he got when x = 0%, implying R support lower. This fits.
Or, if the 80% were included as “individual” (no straight D), then Trump still had to win 10-30% of these (to get the same y), but that’s much harder, since the number of votes called individual are necessarily larger. This leads me to suspect Inventor of Email did indeed separate out straight D ballots.
Example 3
X = 50%, meaning 50% straight R. Straight Ds? Had to go down. Maybe 20%? That leaves 30% remaining individual ballots again! It’s almost like there’s a straight line hiding in the average, just like he found.
Trump would have had to win more than 50% of this 30% to keep y positive. Tough job! The ys for Oakland were about -15% (plus or minus) when x = 50%, meaning Trump won on average about 35% of the remaining 30%. This makes sense: Trump scores about twice as many individuals when x = 50% as when X = 20%. It fits.
When ys for x = 50% are about -20% or -25%, it’s likely the straight D ballots were higher than 20%.
Don’t forget, too, that the sizes of this precincts won’t be the same. I’d bet the smaller ones were the ones with the higher xs on average. The smaller ones would have a harder time besting the x percentage.
Example 4
x = 70%. Ys here are about -25%. How many straight Ds? 10%? 5%? That would leave 20-25% individual ballots. Trump would have had to win more than 70% of these to keep y positive. It’s harder and harder to do.
It looks like Trump won maybe 45% of the individual ballots. So he won more of the individual when x was higher (he won 35% on average when x = 50%). So this fits, too.
Example 5
This is their picture for Wayne Country (Detroit, my hometown).
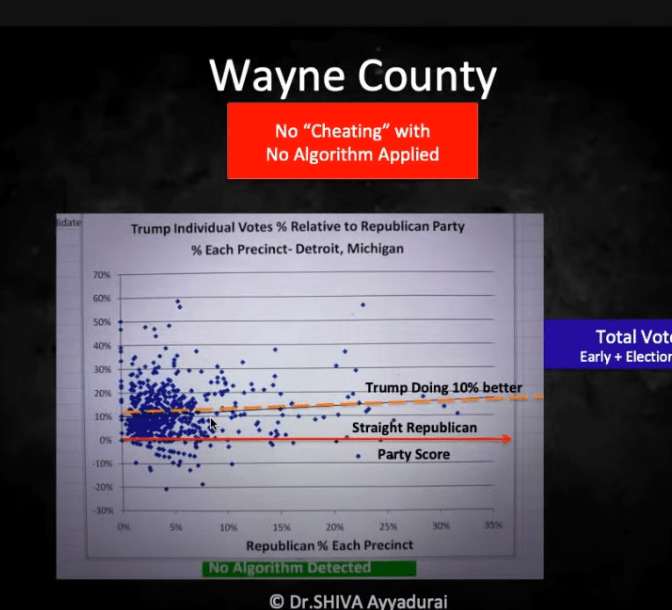
Notice the x-axis scale has changed. Most of the x are below 15%, with only a couple of precincts above: the max is maybe 30%.
Inventor of Emails says cheating was likely not used in wayne county. We saw above that when x is small, that it’s easier to get positive y. That’s what we see here. Recall, too, we don’t see presented the straight D ballots (my guess). This means with small x we’re seeing mostly individual ballots.
It appears to me, then, just like some of us suspected, that Trump did very well with non-party blacks, winning on average 10% of the independent black vote. In many precincts, Trump did much better than 10%, too. It still means that Biden got 90% or so on average, though.
CONCLUSION
I believe Inventor of Email is fooling himself, with the model in general, and with the idea there is some kind of step “fraud” function (my term) that kicks in at 20%. Look at the Oakland picture with fresh eyes and it appears a straight downward sloping line starting at x = 0% fits just as well, or better, than a step function that is flat until 20% and then goes down.
The downward slope is an artifact of the way y is calculated dependent on x. There is no indication of fraud using this method.
I do not say no fraud occurred in Michigan. Indeed, it would be shocking if it didn’t, especially in Wayne county, which has a long and storied history of cheating. It is a Democrat machine town, and everybody knows it, even the people lying and saying they don’t know it.
Everything I said can be checked with the original data. Which I don’t have. Anybody have it?
CODE UPDATE
n = 300 # number of precincts
        # having no idea what number of votes per precinct are, I assumed these
        # more individual than straights on average, which seems plausible
Rs = round(rnorm(n,1.5e4,4e3)) + 5000  # number of straight R per precinct
Ds = round(rnorm(n,1.5e4,4e3)) + 5000  # number of straigh per precinct

Ri = round(rnorm(n,2e4,4e3)) + 5000  # number of R individual votes per precinct
Di = round(rnorm(n,2e4,4e3)) + 5000  # number of D individual votes per precinct

x = Rs/(Rs+Ds)
y = Ri/(Ri+Di) - x

plot(x,y, xlab='R straight %', ylab='R individual % - R straight %',main="Shiva Simulation")
 grid(20)
 abline(h=0)
 fit = glm(y~x)
 abline(fit)
One run gives this:

There’s no cheating here, but also no correlation between straight and individual ballots. That correlation would give more spread to the x (closer to 0s and 1s). I leave it as an exercise, or I might do later, to build in correlation, more variable sizes.
To support this site and its wholly independent host using credit card or PayPal (in any amount) click here
We don’t need Shiva or math* or anything but a brain (in extremely short supply, it seems). Driving in boxes of ballots at 4am, “finding” ballots days or weeks after the election, 100% of the count going to ONE candidate (Democrat), election MONTH–it’s 100% obvious that Americans do not give a damn about honesty in elections. We’re moving to this crap to the courts now, with Soros-backed DA’s not filing charges when we have video, 6 witnesses and a news crew for evidence. Face it, thought is dead, emotions rule and we’re screwed. You don’t need math to see that.
There was a caller on Limbaugh who asked why we don’t just call it 100% for Biden and make the dictator out of him (Kamala-white-privilege-winner, actually) that the left wants. Why bother with stopping the count, adding enough ballots that Biden steals the election, and pretending? Just count ALL the votes for Biden and the tyrants of the past will be cheering in hell and America will be all over. We’re pulling off the bandaid too slowly. Go ALL in.
(Dems have been doing the “box of ballots in the trunk” thing for decades and ZERO was done about, usually “for the good of the country”. It is now obvious how much Nixon hated America and punished us when he refused to fight this fraud. He helped the banana republic on its way. Wonder how much money he made on that move? It’s ALWAYS about money and power.)
*Math is not always the answer, and more and more, it’s really not the answer at all. Apologies to the statistician, but reality sometimes hurts.
”It will not be easy going.”
You did this before breakfast this morning? Monster.
I won’t know what to think until Shecky Greene gives his analysis.
Sheri: ”Face it, thought is dead, emotions rule…”
Dear lady, please note; Briggs is supplying thought, while you are supplying emotion.
And both will be needed for effective action.
This guys demos it pretty well. I’m quite disappointed in Dr. Shiva.
https://youtu.be/aokNwKx7gM8
Nixon should also be reviled for initiating the push to sell the US’ industrial base to China.
With all due respect to Dr. Shiva, the overriding point is that any analysis to be used to show fraud or the absence thereof needs to be able to hold up in court and not torn to shreds by the opposition. That said, it can be acknowledged that his intentions are sound and he did a very good job at getting his “shot” to be “heard around the world” and to kickstart some very crucial discussions and analysis.
Briggs,
You’ve got it all wrong. The x-axis is the republican share of all straight party tickets.
x axis: %republican = R straight party / (R straight party + D straight party)
y axis: %Individual trump – %republican = Trump individual / (trump individual + Biden individual) – % republican
What he is doing is comparing the balance of straight party tickets going R or D to the balance of individual votes going R or D.
In stretched theory, the percent of straight party tickets should be similar to the individual tickets. Or at least, the balance of straight party tickets in a precinct should not influence the individual tickets. Why would trump consistently lose more support among individual voters in heavy trump precincts (by straight party count)?
There’s another guy on youtube who did a bad analysis of Dr. Shiva inventor of email here:
https://www.youtube.com/watch?v=aokNwKx7gM8&lc=UgyYp7sJsy3kFY8DdJ14AaABAg.9G4eDFnkxGY9G5dvxAA9NV
He posts a data source and his spreadsheet:
https://electionreporting.com/county/db3f9865-656b-4704-9429-bd38e726ab42
https://www.dropbox.com/s/7gusbewresl6zsg/Kent%20County%20Precinct%20Data%20from%20Stand-up%20Maths%20video.xlsx?dl=0
Thanks, Sarge, that was a fascinating look into statistical/mathematical methods of vote fraud detection.
Dean Erickson, I get your point about both though and emotion being needed.
However…
The emotion I see displayed in Trump’s rallies is refreshing.
We’ve been oh so thoughtful, lo these many years, while the left has happily trampled all over us. We’ve been very polite, as well. Opened the doors for them, made sure we were all still friends.
What am I saying? I’m tired of watching our America handed over to willful idiocy, to globalist elites……
I’ve watched decades of us taking the higher ground, uncovering all of the evil, sick cabals…..and then watch as nothing ever happens. We’re obviously smart enough to figure things out, why can’t we ever DO anything?
Seems to me like the thoughtful, thinking part never did much! Am I wrong?
This is why I get so frustrated with people’s acceptance of anything that questions the narrative, even when it is suspect. Pushing someone like Inventor of Email makes our side look stupid and silly.
Pingback: Why We Can’t Use Shiva Ayyadurai The Inventor Of Email’s Fraud Analysis | Reaction Times
“His plot is this: the x-axis is the total number who voted a straight Republican ballot, divided by all votes, straight or individual, inside a precinct. In other words, the percent of all votes that are straight R ballots. ”
I think he clearly says that the X axis is the percent of streetlight party votes that were republican. This is his estimate of “how republican” the precinct is.
Does this change your analysis?
I think DMA might be right here, Briggs. The video is confusing, but looking back at it, I do now think it is possible that the x-axes are not the ratio of Straight Republican Tickets divided by all votes, but is instead the ratio of straight Republican Ticket divided by All Straight Party Tickets.
I believe this because Shiva gave an explicit example near the beginning where he divided the total vote of 200 into those who voted straight party tickets which was 60/40 Republican in half the total votes and then the other 100 were individual candidate votes- so in this example hypothetical precinct was at the 0.6 point on the x-axis even though only 60 out of 200 total votes were straight party votes.
In short, your example where the ratio approaches 1 doesn’t mean that there are no individual votes left- you can’t know that number until you actually know the ratio of voters who actually used straight party voting in that precinct. If DMA is correct, you can theoretically reach 1 on the x-axis and still have 99.9% of the voters doing individual votes.
When I first saw this analysis, I had exactly the same thought you had, Briggs- that at 100%, there is no individual vote left, and so it makes perfect sense for the slope to be exactly as it appeared.
I have to think more about this, but Shiva could be right, or he could still be wrong.
One of the things niggling at me was the idea that 70% of the voters in of any precinct in Oakland County, Michigan would vote a straight Republican ticket- I should have listened to that niggle. It now makes far more sense that it was 70% of the straight party voters were voting the Republican ticket, but it might have only been 25% of the total voters in the precinct, and is, in fact, a far better guage of the partisan tilt of a precinct- 70/30 of the harder core partisans are Republican, leaving the individual voters more diffuse.
I think Shiva gives this explanation ,although not clearly, at about 19.5 minuets in.
And I see Jim T had the same point as DMA.
19.5 minutes–sort of a long time to dance.
Yes, if the non-straight party tickets deviate significantly from the straight ticket ratio, then it might indicate fraud if it only occurs in more Republican leaning precincts.
Jim T, others,
See the updates above. The method may be different, as you suggest, but the conclusion is the same. The larger the x the harder for y to be positive.
The way I read it was that white Republican split ticket males abandoned Trump
en mass and elected Biden. Which coincidentally was what the mockingbird
press was pushing across the board. They had to steal the election from Republicans
or the voter registrations vs. votes cast would quickly demonstrate the fraud. But
I’m no mathematician.
The big tell in the mass media that a false narrative was being propagated
was the emphasis on white Republican males being responsible for Biden’s election.
It’s almost sleight of hand.
Predictive programming anyone…
Bizarre EU-Funded Comic Book Predicted Pandemic, With Globalists As Saviours
https://www.zerohedge.com/political/bizarre-eu-funded-comic-book-predicted-pandemic-globalists-saviours
“Updates
Some are saying IOE meant x = R straight ballots/(R straight ballots+D straight ballots).
And y = (R individual / R individual + D individual) – x.”
I think he used y= (R total/total votes)- x
This seams to me to be a comparison of total republican votes to an estimated 0 line. The result could have had x as any value and the shape of the plot is what is important not the estimate of switched votes.
DMA,
Lord knows you might be right, too.
But use the same example as above. 1 R straight 0 D straight, for x = 100%. Then (in your guess) y = 100*(91/100) – 100 = -9.
Of course, with this x = 1, a more realistic measure might be y = 100*(51/100) – 100 = -49.
The larger x is the more the R votes seem to be sucked away, leaving little left for the first part of y to be bigger.
Seems to be about the same. Larger x, smaller y.
It looks to me like y is indeterminate (nan) for x = 100%, not zero. Would that matter?
Let’s try this statement of the problem. Per precinct:
R is straight-republican (Trump) votes
T is total votes
R_I is individual republican (Trump) votes
T_I is total individual votes
T_S is total straight votes
X = R / T
Y = R_I / T_I – X
T = T_I + T_S
When X=1, R = T = T_S, and thus T_I = 0 and R_I = 0, which makes Y indeterminate.
So, Y = NaN, not Y = 0 for X = 1.
V,
Sure, if number of individual (R+D) ballots is 0, meaning all ballots straight, then y is indeterminate. Probably didn’t happen in the real data.
Briggs,
You are the man, but I’m still not convinced… A high straight party %R doesn’t preclude a high individual vote %R
Here is how I see it:
In any precinct, separate all votes into two groups: straight party ticket, and individual.
Now take the %R of both groups and compare.
In a demographically ideal world, they should be roughly the same.
Dr. Shiva just takes the difference to compare the two. In the ideal world, the curve would be y = 0
Have a look at the data from the stand-up math’s guy on youtube. He also has Biden’s data on there too.
If you overlay the Trump and Biden data, you will see that where Trump’s individual vote %
Jim T,
I take your point, but I don’t believe it with any of the definitions of y we’ve see, because I’m thinking the higher x is the smaller the precinct, and small samples are more variable.
When x is near 0, the number of D straights aren’t really important per se, and any number of Trump votes makes y positive. When x is large, it’s harder to get a high total in the remaining individual, making y negative.
The intercept and slope depends on the county background, which explains the difference between Oakland and Wayne, which most places have small x. Macomb is larger xs. And it does stay positive longer.
In any case, we’d expect a downward sloping line, starting positive, ending negative.
I think we have to look at a different scheme. I will get to the stand-up math guy. Thanks.
I’m finding this discussion quite interesting, but must admidwit, not quite following the longhairs. But I can serve refreshments from my bar cart, and here’s a warm plate of horse’s doovers — drinks are on me, what’ll it be, m’bhoys? Recommend the gin & tonic, just the thing for these poxxy times, juniper berries from my own trees, and top drawer quinine freshly brewed this morning from the best cinchona bark. Can probably rustle up a string quartet, if you like. Oh, and there’s some cigars around here too, somewhere… port? — sure. This here’s a class joint.
Jerry: ”I’ve watched decades of us taking the higher ground, uncovering all of the evil, sick cabals…..and then watch as nothing ever happens. We’re obviously smart enough to figure things out, why can’t we ever DO anything?”
Great question. I’d dive in, but must get in kitchen and start cooking, and have already tried host’s patience with enough off-topic blather for one evening. Great question, though.
So if there’s a problem in the analysis, any candidates votes should follow this pattern, for any county, in any year? In particular, on the other side of the coin, Biden’s votes should show the same pattern.
I think more realistic numbers might better demonstrate the limitations:
Let’s say there are 1000 voters in a precinct, and 300 of them vote straight tickets one way or another- 200 for Trump and 100 for Biden. The remaining 700 voter split their tickets, but the same percentages generally vote for the Republican candidate across the entire ballot, so in the entire precinct, Trump still gets 667 votes, and Biden gets 333 votes. This sets up the zero line- Trump got 66% of the straight party vote and 66% of the split ticket vote- y=66-66.
If we take the extreme case where Trump got 99% of the straight ticket vote, but only got 80% of the split ticket vote, then, sure you get negative numbers, but it is no longer guaranteed with the previous definition of what x is. Trump could easily get 99 and 99 in a precinct or 1 and 1, but what isn’t going to be common is that the two different percentages are going to vastly different. I don’t even think 99 and 80 is very likely- something more along the line of 99 and 95, and such extremes aren’t even going to common on the Republican side because there probably aren’t very many precincts anywhere that the straight Republican ticket dominates by more than 80/20, even in Barebutt, Oklahoma.
As a rule, I think the zero line should be obeyed by both parties’ voters, and one way deviations from it might well indicated systemic fraud.
What about the 100,000 ballots delivered in the middle of the night that were 100% marked for Biden with no down ballot votes at all? Those are neither straight nor split. They are pure fraud. The election was stolen by cheats.
Nobody marks a ballot with one vote for the Presidential race and zero votes for anything down ballot. If you vote, you vote the entire ballot. The exception might be those races where only one candidate was listed because they ran unopposed. No point in voting on those races. But most races are contested by two or more candidates, and people who bother to participate vote for one candidate or the other, and the various measures, down the entire ballot.
The mere presence of 100,000 singularity ballots all for one Presidential candidate and nothing down ballot is ample evidence of fraud. You don’t need a stat model to prove that. If those singularity ballots exist, and they either do or they don’t, then the case is open and shut.
Caveat: if those singularity ballots were flown to Germany to be counted, they might have been destroyed over there afterwards — but then that’s proof of fraud, too. Germans count our votes? Did we outsource democracy? Un-freaking-believable!
Personally I discount any and all analysis from someone who adds “Inventor of email” after his name like he does.
And more seriously, his method is way too convoluted. Too many leaps of faith. The minus sign is, as Briggs says, the first stumbling block – it just comes from nowhere and has a bunch of assumptions within it. The idea there is a step at 20% is frankly preposterous, and I can’t get past these two.
If you need dubious leaps like this, you make it look like there is no fraud – and yet, clearly there is, it’s flashing in Neon lights. So simple tried and tested analysis is all that’s needed. Maybe he should spend those extra seconds he keeps wasting typing “Inventor of email” consulting some classic multivariate stats texts.
Could also just plot % individual v. % total for each candidate. One arguable expectation would be a line with slope 1. Probably could only be interpreted correctly relative to both historical and wider/other-area data.
Arithmetic differences can be a little janky.
Incidentally, following the spirit of Uncle Mike, the easily ascertained fact that the voting machines were on-line, as reported by Politico, is enough to discount the entire election. (A company tech was able to upload to and crash a machine.) Further, if votes were indeed sent to non-US portions of the Amazon cloud, that constitutes an Export violation.
Both above factors, if accurate, indicate systemic inaccurate and illegal voting activity. Which means there is no way to be certain of the vote count or the error bars.
It’s not extreme to say a redo is in order. Since that’s probably not going to happen, we resort to statistical retrospectives.
Why don’t some of the people commenting try plotting some of the data. It exists on https://www.electionreporting.com/
Not for all the counties in Michigan but by precinct for 17 counties. I’m not sure what it will show and some may have better excel skills than I do.
In looking at Dr. Shiva’s work I thought that he mis-interpreted the problem he saw in the data and got so carried away trying to explain a difficult idea to simpletons that he buried his message in inappropriate simplifications like the use of percentages.
However.. have you seen this one:
https://rumble.com/vbas2t-smoking-gun-dominion-transferring-vote-ratios-between-precincts-in-pa.-by-e.html
by an Edward Solomon? To me, this looks much better – and it would seem to transfer to explain the anomolies I think Shiva mis-represented.
Please take a look – I would much appreciate your, and this group’s, take on it.
The Solomon data for Philadelphia is interesting but they do not use Dominion.
Dr Shiva’s analysis involves arithmetic and relational operations on percentages derived from populations of different sizes. It is therefore inflicted with serious bugs that are clearly illustrated by the famous Simpson’s Paradox.
Do the same analysis but use Biden instead of Trump.
Lol, you now have Ayyadurai’s analysis showing Trump fraud.
Dr Shiva is fully aware of the fact that his first theory is fundamentally flawed. This is why he is now advancing a new theory that contradicts the old one. Go figure!
Pingback: Everything You Need to Know About 2020 Election Fraud, but the Media Won’t Let You Ask (from The Stream)
Pingback: Everything You Need to Know About 2020 Election Fraud, but the Media Won’t Let You Ask | The Stream – We the Pundit
Pingback: Last Word On The Election (For Now) — With Bonus Podcast! – William M. Briggs