Overview
Regression, a.k.a. “linear regression”, is the most-used analysis technique, responsible for nearly all headlines which begin, “New research shows…” Its misuse is also the biggest reason for scientists, a.k.a. “researchers”, believe and promulgate nonsense.
The technique is fairly easy to grasp, at least in the sense that its implementation is trivial. And that is the problem. It’s too easy; or, rather, cheap software combined with a bit of magical thinking (decision by wee p-values) make using regression painless. “Results” are for free the asking—and you know the saying about getting what you pay for. Which is why there is a flood of papers gushing out of academia “proving” anything researchers want to believe.
So what is regression? Let’s first discuss what it should be in broad outline form, eschewing all technical details, which we’ll come to later. Let’s not worry about how it works—no distributions, parameters, or p-values this time—but what it means. All along I’ll give tips on how it is misused and misinterpreted.
Start simple. You have some thing, which is represented by a number, and you want to express the uncertainty that the thing takes certain values. It is customary and a great convenience to call this thing “y”. Y might be a grade point average, an amount of money, tomorrow’s high temperature, an answer to an arbitrary question (“On a scale of 1 to 5…”), and so on endlessly.
Sociologists, who form the largest group of abusers of statistical methods, are great ones for inventing questions and imbuing them with terrible meaning. Typically, they create a questionnaire the answers of which are coded numerically. From these a “scale” is derived, i.e. a number which is a function of the answers. This scale usually ranges from 1 to 5, or from 1 to 9, or something like that. It is always given a hopeful name, like “The Conscientious Index”, “Openness to Change,” or “General Health”. (More on this in another post.)
To fix ideas, use the fictional “Hate Scale” for our y which is comprised of the single question, “On a scale of 1 to 10, how much do you despise those who disagree with you politically?” Apt for our current political milieu. We want to understand the uncertainty of a person answering this question. With what probability will he answer 1? 2? and so on. This is what regression is meant to tell us. Never mind now how regression assigns probabilities, just keep in mind that it does.
Now we might also measure a person’s biological sex speculating males and females will answer the question differently. Or perhaps older or younger people answer differently, so we measure age. Education might play a role. And so forth. There is no limit to the number of things which might cause a person to choose his answer, and indeed something (or things) causes each person to pick his answer. But regression is not (or not usually) a causal discovery model. It is merely correlative. The idea is to measure just those characteristics—call them x’s—which change our minds about y. That is, if the probability y takes a certain value changes knowing a person has this rather than that value of a characteristic, then that characteristic is important to understanding y. If there is no change in the probability of y varying the characteristic, then the characteristic isn’t important.
Regression is supposed to be this: given a particular value of each of the x’s in our “regression model”, regression gives us the probability y takes the values it can take. That’s it; that’s all regression is, or that’s all it should be. Statements of results should concentrate on how much, if at all, each of the x’s change the uncertainty in the y. Causative language should be minimal and cautious.
Before (next time) we get to our main example, regression is meant to be this. Suppose all we had in our model was sex, male or female. Y can take the values 1, 2, …, 10. Given a set of observed data and knowing a person is a male, the regression should tell us the probability this male answers y = 1, y = 2, … and y = 10. Then knowing a person is a female, the regression should again tell us the probability this female answers y = 1, y = 2, … and y = 10. If these two sets of probabilities are exactly the same, then knowing a person’s sex is irrelevant to knowing their Hate score. If the two sets different for any of the levels of y, then something about sex, or something associated with it, is relevant to understanding the uncertainty in the score.
Regression is thus a prediction. It tells us the probability of “events” not yet seen. Consider we do not need regression, or any statistical method, to tell us about the data we have observed, because—can you guess?—we have observed that data. Except in those instances where data is measured with error, we know everything there is to know about that data. If we want to know how many men (of any kind) had Hate scores greater than 5, all we have to do is count. We don’t need to “estimate” anything—except for that which is still hidden from us, like the future.
Simple as that. So why are regression results never stated in this form?
Next time: examples.
Discover more from William M. Briggs
Subscribe to get the latest posts sent to your email.
Because I, like most, was taught that regression is a method of prediction, not of probability.
It’s nice to see an explanation with the jargon and symbols of mathematics minimized. Almost universally, teacher of math are enamored of these devices because they are adept at using them. What they fail to understand is that many (most?) students are not so skilled and baffled by the shorthand. Unable to grasp the intangible concepts denoted by this foreign language, their brains fog up. Explanation in a common tongue at least gives the non-intuitive a fighting chance at understanding.
If these two sets of probabilities are exactly the same, then knowing a person’s sex is irrelevant to knowing their Hate score.
Finding two sets of probability exactly equal is rare with any given data set — even if they are “really so” in the general population.
Do you plan to address this as we go along?
FWIW: my response to the Hate question is 4.7396. I’ll leave it to the researcher to determine if that means more or less hate.
Gary,
Because I, like most, was taught that regression is a method of prediction, not of probability.
Well, the regression (usually) isn’t giving you the probability directly. It instead is giving the most probable (specifically, the weighted average) Y value for any given X based on the data at hand. Applied to new data, it becomes a prediction.
Regression analysis can be described as one of many heuristic approaches to deciding up the inferences that will be made by a model. On each occasion in which a particular heuristic selects a particular inference for being made, a different heuristic selects a different inference for being made. In this way, the method of heuristics violates the law of non-contradiction. The alternative to the method of heuristics, information theoretic optimization, avoids violation of non-contradiction and yields better results but costs more money.
DAV, yes, I understand the math, but I was answering the specific question.
Why is it called ‘regresssion’?
From an online dictionary –
1. the act of going back to a previous place or state; return or reversion.
2. retrogradation; retrogression.
3. Biology . reversion to an earlier or less advanced state or form or to a common or general type.
4. Psychoanalysis . the reversion to a chronologically earlier or less adapted pattern of behavior and feeling.
5. a subsidence of a disease or its manifestations: a regression of symptoms.
Gary,
I added a paragraph at the end to answer your question, which DAV got right, but I fleshed it out a bit.
I love it when an explanation starts with the meaning instead of the details! Eagerly awaiting the sequel!
I use regression all the time in my research, both linear and non-linear and have even written some of the programs that I have used, but it seems to have no relationship to what you talk about. You need it for curve fitting and to estimate parameters of theoretical interest. You certainly can not get this by observing the data. It is just a slightly more sophisticated improvement on graph paper, pencil, and a straight edge with a French curve occasionally thrown in for good measure. There are no p-values as what would be the point? However, there is the occasional R value or the standard deviation of a fitted parameter. We have had this discussion before and I am sure that your response will be the same. In one of your future examples show, let’s say, experimental I-V data fitted to the diode equation. The problem with the sociology examples that you use is that the data is junk to begin with and it is sort of like shooting fish in a barrel.
Scotian,
No, it doesn’t resemble what physicists do, does it. Well, one day after I praise physicists for their math, today I do the opposite. Good news is that physicists are not alone here.
Let me ask this: is the Planck constant real? I mean, ontologically real? It exits as a thing, an entity, like a quark can be said to exist? Obviously not. Likewise parameters in regressions also do not exist, but are abstractions of one kind or another. Wouldn’t it be a more interesting physics—a theory of everything, maybe—with no parameters, only models derived from first principles? A rhetorical question.
Now at least in physics, chemistry, and sometimes biology, there are meanings attached to parameters that make a kind of physical sense. This is not so for other uses of regression. The parameters are still given meaning, but it is wholly fictional.
More on this coming.
Briggs,
It is the length of the Planck. Is the square root of two real? Is that sum really -1/12? Of course they are abstractions but then again our perception of colour is an abstraction. Even quarks are abstractions. You know, God made the integers and all else is the work of man, that sort of thing.
Only models eh, no parameters, hmm wouldn’t first principles be parameters? No rhetorical questions just rhetorical answers. A kind of physical sense? Gee thanks.
Finally, Physicists are always alone, so very alone.
Scotian,
Our perception of color is a qualia and comes from an objectively real source. God made the integers, all right, plus all that other stuff. Put it this way: We cannot discover truths that are not truths.
Just rhetorical questions for now. Answers are coming in future posts.
Briggs, colour comes from an objectively real source. Sure of that are you? Check out:
http://brainden.com/color-illusions.htm
“We cannot discover truths that are not truths.” Is this a Zen thing?
Briggs, I see that you have a picture icon now for apple (ipad). The man in a fedora.
First sentence in: http://brainden.com/color-illusions.htm: Color Illusions are images where surrounding colors trick the human eye into incorrect interpretation of color.
The statement implies there are “true” colors but you can be fooled into seeing the “wrong” color and colors that are “not there” — for example, with RGB displays. IOW: colors are an objective attribute. I, myself, am of the opinion that color is an interpretation of physical inputs and is purely subjective. That we share this interpretation arises from our all being built with mostly the same hardware.
“Regression is thus a prediction. It tells us the probability of “events†not yet seen”
Won’t it be simpler and better to say that regression merely measures correlations in the data. Prediction itself requires a theory. At least, the prediction must assume that the future would be like the present.
“a quark can be said to exist?”
Does a quark exist in the same sense as an apple exists?
A quark is essentially an entity posited within a physical theory. An apple is a directly perceived object.
Scotian & Briggs:
Isn’t part of the difference between a physicists constant and a social scientists constant, the fact that the former becomes a starting point for further, deeper and possibly endless speculation, while for social scientists it is treated as real. For example, in economics we have the notion of a multiplier. Conceptually it makes sense, but once a number is attached all the ifs and buts and ceteris paribus seem to disappear in a blaze of certainty.
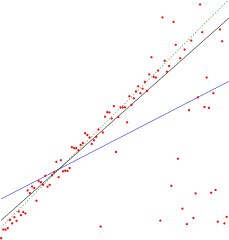
As someone who spends way to much time looking at economic models, could you be so kind as to explain the you issues with the “GDP vs unemployment” chart above?
“The technique is fairly easy to grasp, at least in the sense that its implementation is trivial. And that is the problem. It’s too easy; or, rather, cheap software combined with a bit of magical thinking (decision by wee p-values) make using regression painless. “Results†are for free the asking—and you know the saying about getting what you pay for. Which is why there is a flood of papers gushing out of academia “proving†anything researchers want to believe. ”
Can we say Linear No Threshold?? Yes we can.
from Gian’s 1/22/14 comment . . .
“Regression is thus a prediction. It tells us the probability of “events†not yet seenâ€
Won’t it be simpler and better to say that regression merely measures correlations in the data
—
Isn’t it the case that because the regression measures the correlations in the data, that if we are given a new set of observations for the “x” values, that we can apply the correlations to get a weighted prediction of the Y value? It seems to me that exactly what you described is exactly what supplies the “predictive” power.
HWR 1/30/14:
As you imply, regression analysis provides an answer to the question of how to provide weighted Y values. However, the question facing a scientific researcher is how to provide weighted Y values in a logically justified manner. Regression analysis is not an answer to this question.
Pingback: Stream: No, a Study Did Not Show That Same-Sex “Marriage” Laws Reduce Teen Suicide Rates – William M. Briggs